
Vulnerability analysis results in Orange Cyberdefenses’ Security
Navigator[1] show that some
vulnerabilities first discovered in 1999 are still found in
networks today. This is concerning.
Age of VOC findings
Our Vulnerability Scans are performed on a recurring basis,
which provides us the opportunity to examine the difference between
when a scan was performed on an Asset, and when a given finding on
that Asset was reported. We can call that the finding ‘Age’. If the
findings first reported are not addressed, they will occur in more
scans over time with increasing Age, and so we can track how the
Age of reported findings changes over time.
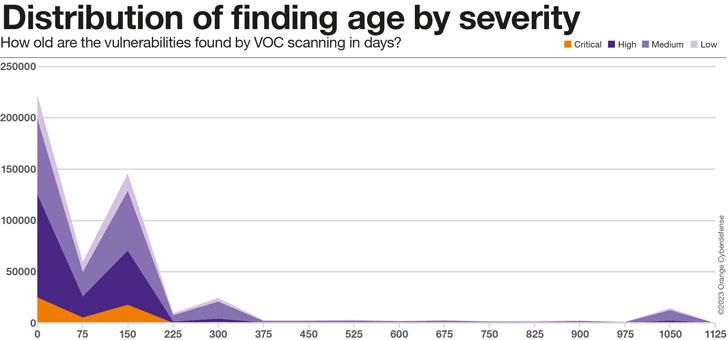
As the chart below clearly illustrates, the majority of real
findings in our dataset, across all Severity levels, are between 75
and 225 days old. There is a second ‘peak’ at around 300 days,
which we suspect has more to do with the age of the data in the
dataset and can therefore be ignored. Finally, there is a
fascinating ‘bump’ at around 1,000 days, which we believe
represents the ‘long tail’ of findings in the dataset that will
simply never be addressed.
75% of the findings in the 1000-days ‘bump’ are Medium Severity,
but 16% are classified as High or Critical Severity.
The Average Age of findings in our dataset is impacted as much
by changes in our Customer and Assets set as any external factor,
as can be seen in the high degree of variation. Yet, there is a
clear increase in the Average Age of findings of 241% from 63 to
215 days over the 24 months since we’ve been onboarding clients
onto this platform.
Roughly grouping confirmed findings from our
Vulnerability Scan data by ‘Age Group’ reveals the
following:
- Only 20% of all findings are addressed in under 30 days
- 80% all findings take 30 days or more to patch
- 57% of all findings take 90 days or more to patch.
- 215 days Average
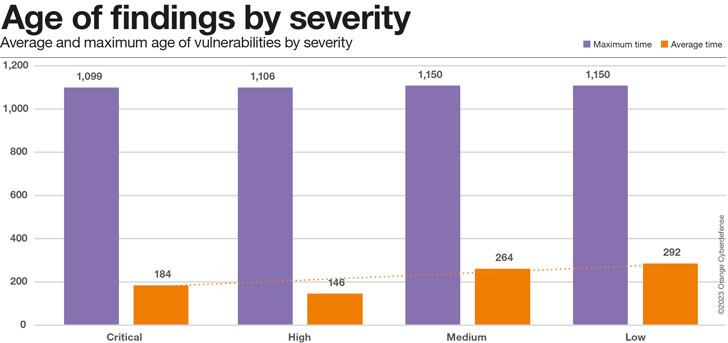
Average/max age of findings by severity
The chart below suggests that even Critical Vulnerabilities are
taking around 6 months on average to resolve, but that is
encouragingly at least 36% faster than the time for low-severity
issues.
Taking a closer look at the readings of average vs. maximum time
for different ratings of criticality we end up with the chart
below.
While our conclusion of critical issues being resolved faster
stands for the average mitigation time, the maximum time is
consistently high regardless of criticality.
We will have to watch this metric more as the dataset grows in
the future.
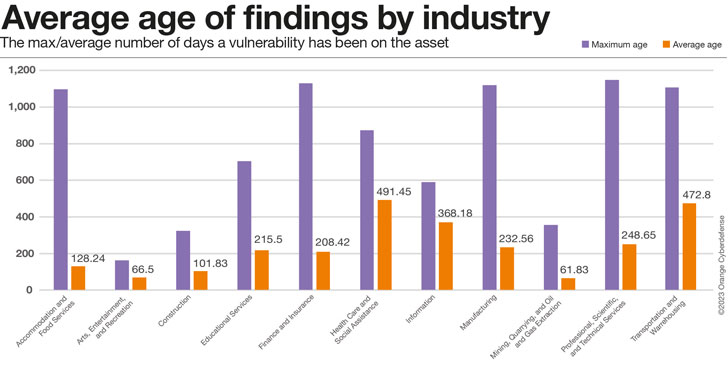
Industry Comparison
The maximum age of findings in the view below serves as much as
an indication of how long customers from that Industry have been
present in our dataset as anything else, while the average age is a
better proxy for how well customers are doing at addressing the
issues we report. Industries with high maximums and low averages
would therefore be doing the best, high maximum and high average…
the ‘worst.’ Industries with very low maximum ages have probably
not been in the dataset for very long and should, therefore,
perhaps not be included in comparisons on this metric.
However these Industries are compared, the finding Age
is a concerning metric.
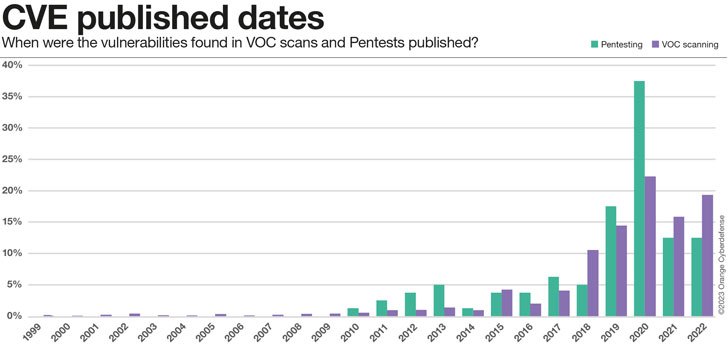
How old are those vulnerabilities really?
So far we have only looked at the relative time, from when we
first found a vulnerability in an asset up until now (if still
present). However, that does not give us any information on how old
those vulnerabilities really are. Taking a closer look at the found
CVEs we can analyze their publishing dates. The results are
somewhat baffling, but seem to fit the picture that emerges: for
one reason or another, some vulnerabilities are just not fixed,
ever. They become part of the security debt that businesses
accumulate.
- 0.5% of CVEs reported are 20 years old or more
- 13% of CVEs reports are 10 years old or more
- 47% of CVEs are 5 years old or more
Conclusion
More than 22 vulnerabilities with assigned CVEs are published
each day. With an average CVSS score above 7 (High Severity), each
of these disclosed vulnerabilities is a significant datapoint that
affects our risk equations and our real exposure to threats.
Vulnerability Scanning and Penetration Testing are mechanisms we
use to make sense of the vulnerabilities that may impact our
security posture, understand their potential impact, prioritize and
take appropriate action. These two assessment exercises are
different in approach, but use similar language and serve a similar
purpose.
This year we are including an analysis of datasets from both
services in the Navigator. This is the first time we are attempting
this, and our data is still far from perfect.
What we can clearly see is the we’re struggling to manage the
vulnerabilities we know about. On average, it is taking our
customers 215 days to patch a vulnerability we report to them. This
is a little lower for Critical Vulnerabilities – it appears these
are patched 36% faster than ‘Low’ severity issues. But the picture
is still grim: 80% of all Findings take 30 days or more to patch,
57% take 90 days or more.
Our pentesting teams are still discovering vulnerabilities that
were first identified in 2010, and our scanning teams encounter
issues that date back to 1999! Indeed 47% of CVEs are 5 years old
or more. 13% are as old as 10 years or more. This is a concerning
result.
This is just an excerpt of the analysis. More details, like the
criticality of vulnerabilities and the changes in Pentesting and
VOC scanning results over time (as well as a ton of other
interesting research topics), can be found in the Security Navigator[2]. It’s free of charge, so
have a look. It’s worth it!
Note: This informative piece has been expertly crafted
and generously shared by Charl van der Walt, Head of Security
Research at Orange Cyberdefense.
Found this article interesting? Follow us on Twitter [3]
and LinkedIn[4]
to read more exclusive content we post.
References
- ^
Orange
Cyberdefenses’ Security Navigator
(www.orangecyberdefense.com) - ^
Security
Navigator (www.orangecyberdefense.com) - ^
Twitter
(twitter.com) - ^
LinkedIn
(www.linkedin.com)
Read more https://thehackernews.com/2023/01/security-navigator-research-some.html